
Spain
Valencia
- Annual energy
- 192.6GWh
- Mean
- 22.0MW
- P95
- 32.1MW
BRIDGE ELECTRIFY · A Bridge EMIP platform
Onshore power supply · whole-port energy
We model OPS demand port by port from real ship-call records, test the scenarios that drive cost, and turn them into an integrated, phased energy and delivery plan for the whole port.
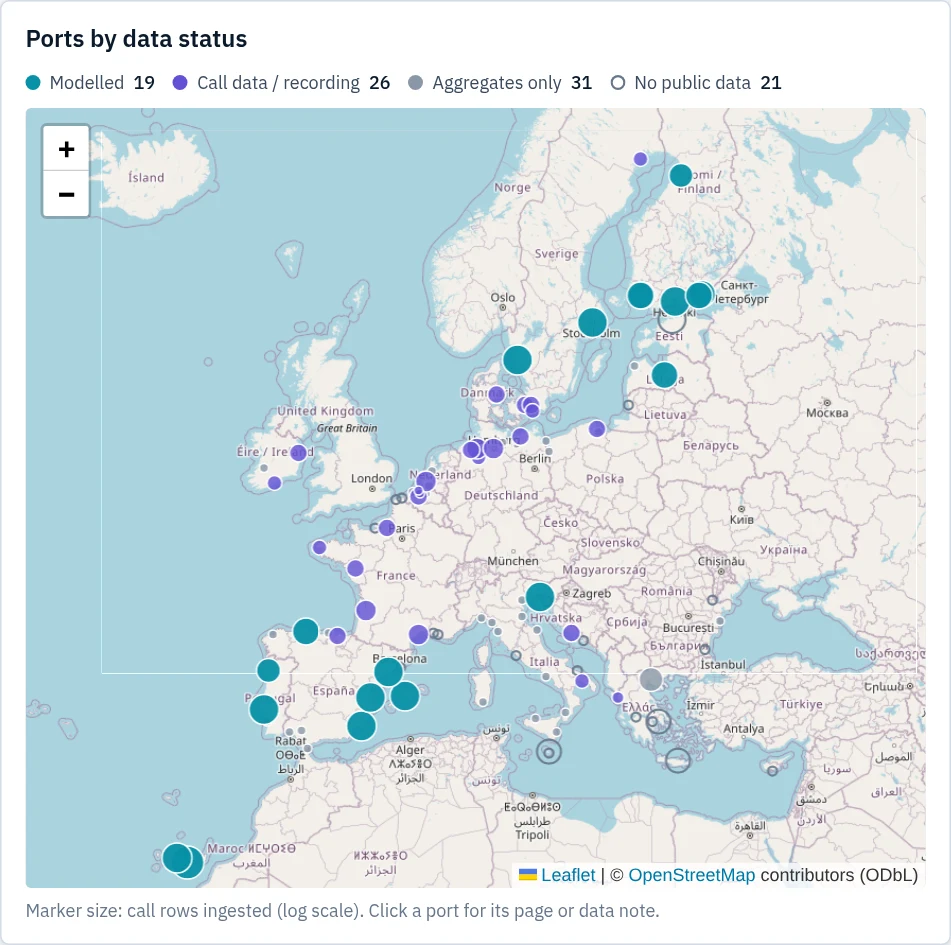
Modelled estimates from public ship-call records, as shown in the Bridge Power working model v0.2.1 (built 2026-11-10). Surveyed ports were checked for public call records; only ports publishing calls with actual times are modelled.
Modelled ports
Selected examples of ports preliminarily modelled using public call data; indicative estimates, not completed client engagements or endorsements.
Spain
Spain
Spain
Scenario: 2025 · mid power · full adoption. Six examples on the Modelled ports page.
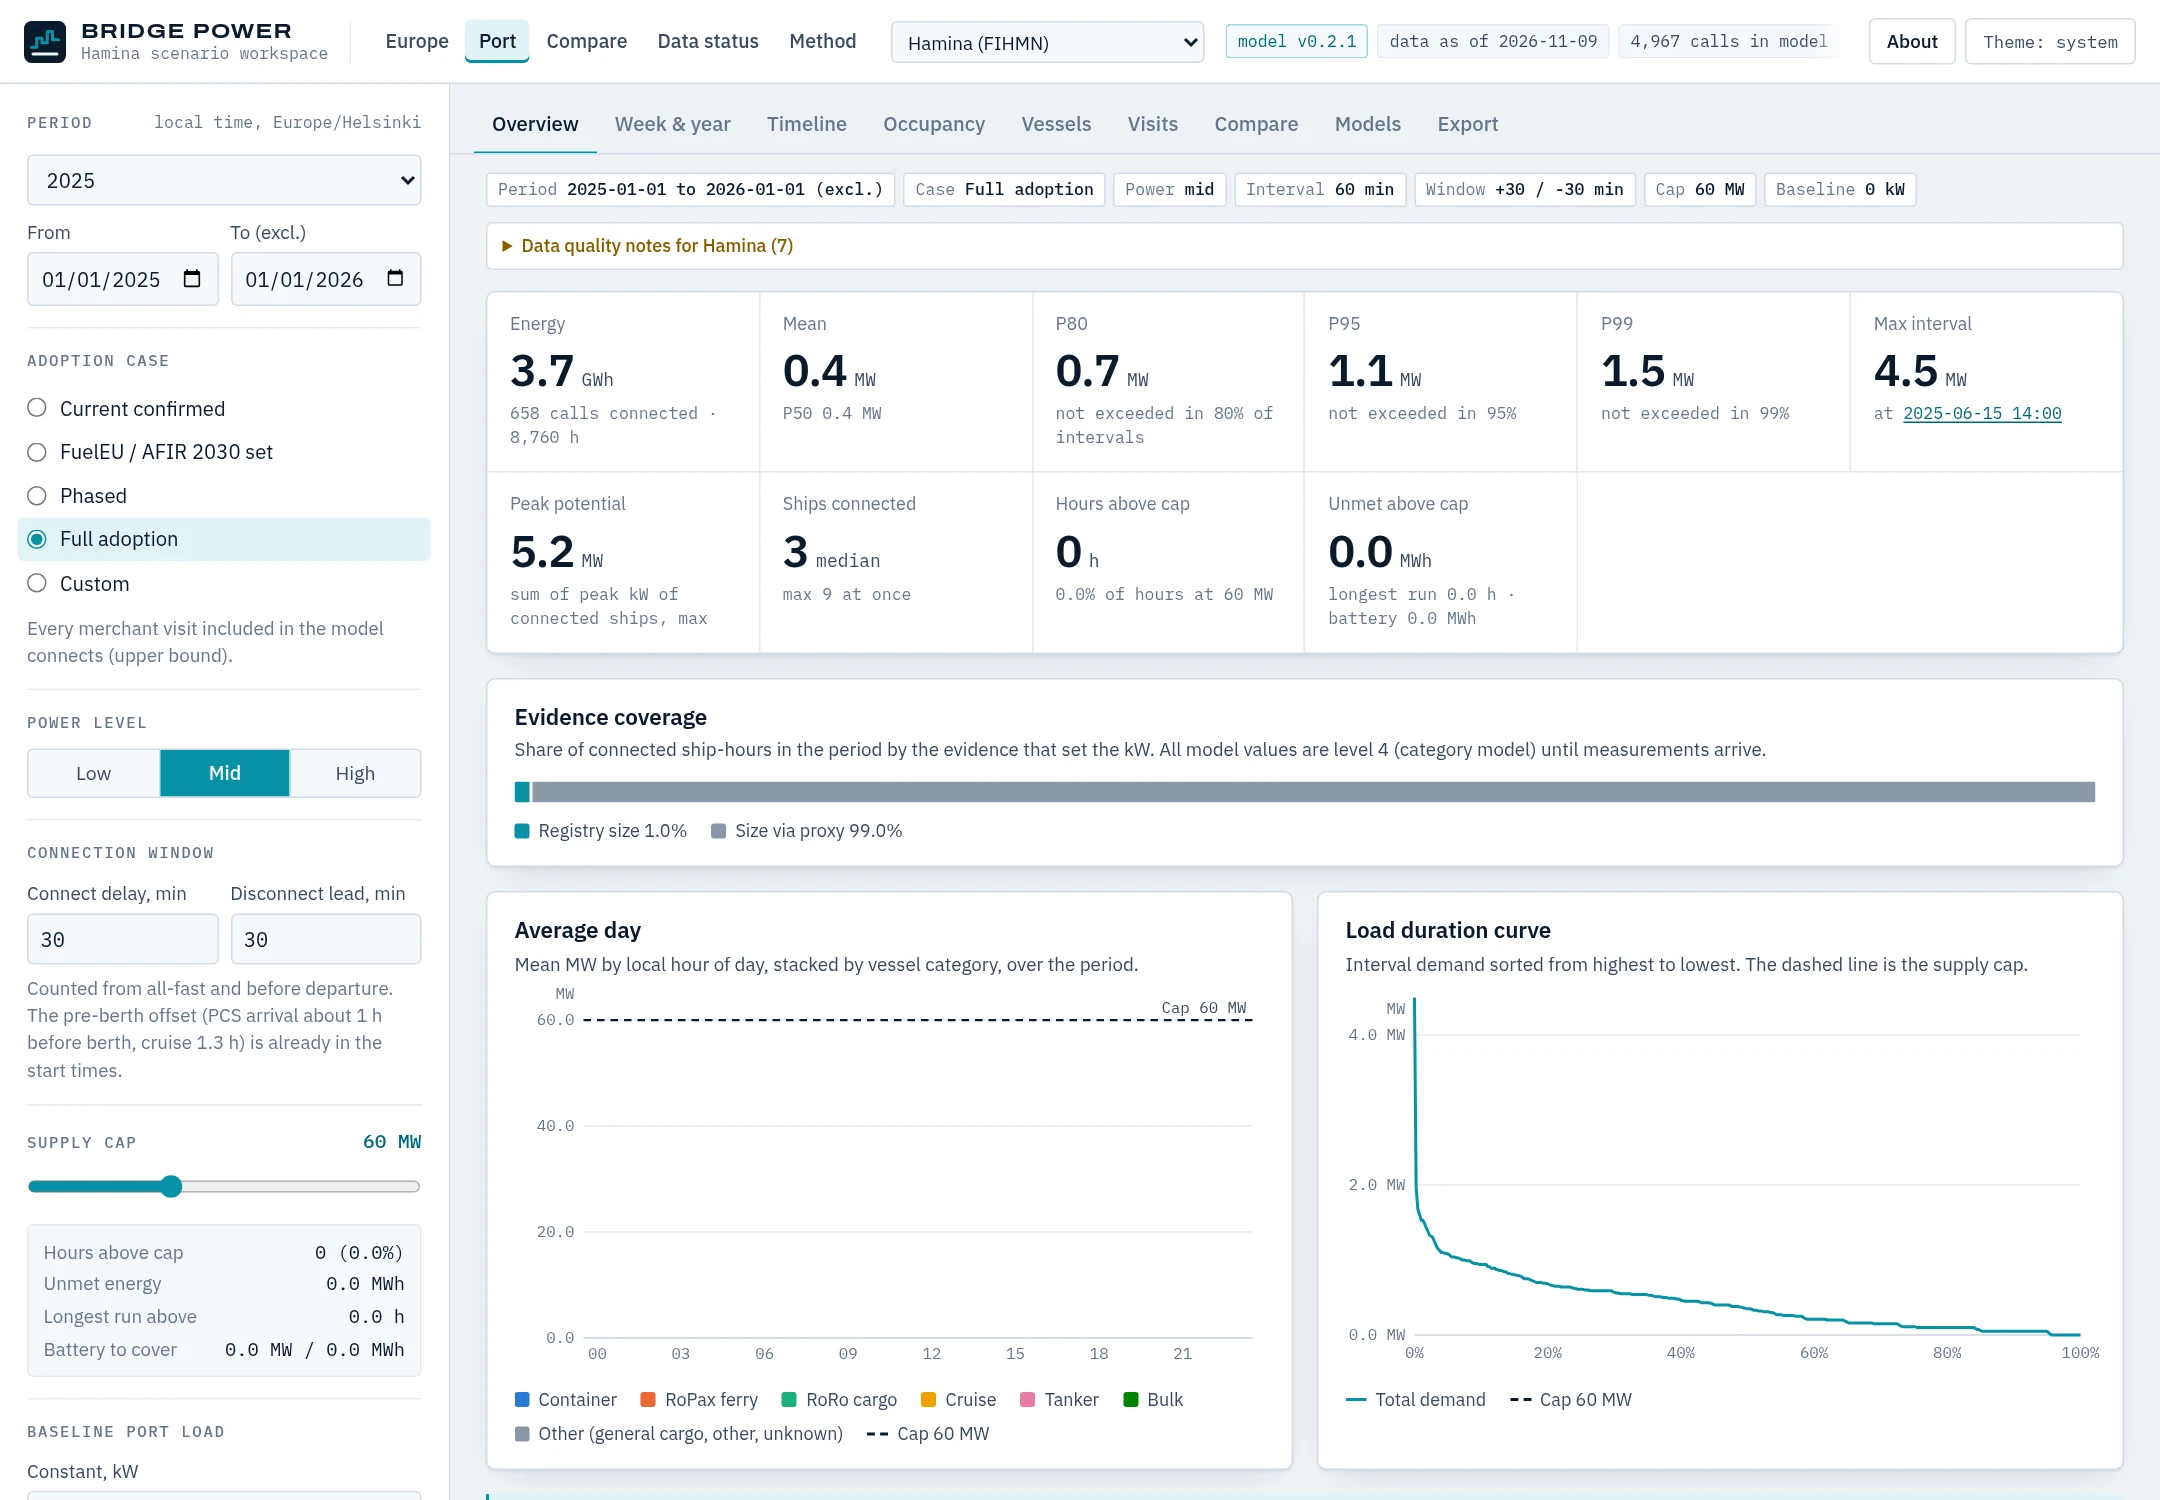
Worked example · Hamina, Finland
The gap between P95 and the highest hour is the planning question. P95 is a demand threshold, not a grid design: a cap at that level is exceeded in about 5% of hours, and the duration of those peaks and the energy above the cap must be assessed before storage or operational limits can be sized. Here, every vessel figure is still a category estimate — measured data would sharpen it.
Scenario: 2025 · mid power · full adoption, 60-minute interval, ±30-minute connection window.
Explorer & scenarios
Which vessels and berths first
Rank berths by the energy and connection hours they would actually deliver, by vessel type.
Annual energy versus power
Annual GWh frames the business case. Hourly profiles, mean, P95 and peaks inform grid and phasing discussions. P95 covers 95% of hours, not 95% of energy.
Adoption, connection and capacity
Compare current, regulatory-driven, phased and full adoption, with connection times and a supply cap.
Phased investment
See where a capped first phase covers most hours, and what storage or reinforcement would cover the rest.
Data gaps, made explicit
Every figure shows its evidence level, so you know what your own data would improve.
What you receive
Beyond the berth
Bridge then brings terminals, equipment, charging, grid and generation into one system, and helps shape delivery — including equipment supply and concession or partnership structures, with scope and commercial interests made clear in each engagement.
Turn public and port call data into hourly onshore power supply (OPS) demand by vessel type and berth — then test adoption, vessel power, connection time and supply-capacity scenarios.
Bring in terminals, charging, equipment electrification, the grid connection and on-site generation as one connected system.
Test storage, tariffs, phasing and lifecycle cost — and compare ownership against concession or partnership structures.
Client workspace
Invited clients see each assessment stage and its approved releases in a private, sign-in-only workspace. Nothing is published to you without review.
Planned module
Available within a scoped engagement; model integration follows.
Planned module
Available within a scoped engagement; model integration follows.
Planned module
Available within a scoped engagement; model integration follows.
Name your port and the question you need answered. We'll suggest a sensible, scoped first step.